—David Berlinski, The Advent of the Algorithm
I suspect that same will be said of our industry.
One such precision tool is relationships. At the base of any good domain expertise pyramid is a whole mess of relationshps between two or more variables. What is the relationship between compensation and performance? How are budgets spent across the development and launch of a new project?
Here are some of my favorites generic relationships.
- The linear relationhips.
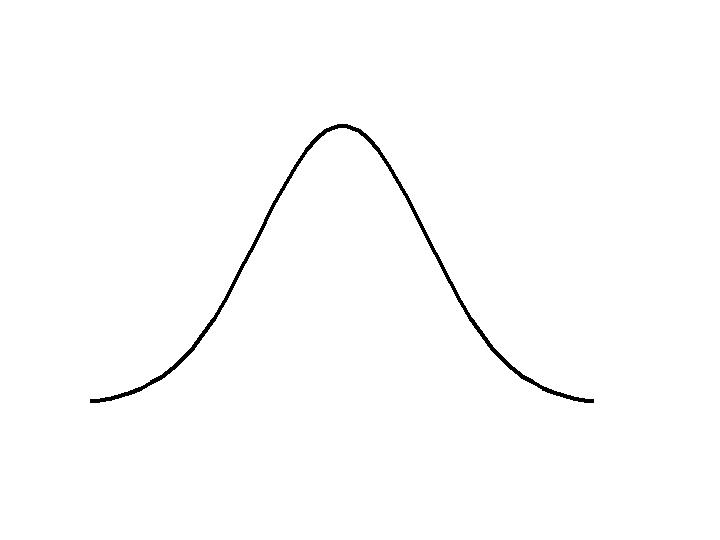
- The bell curve.
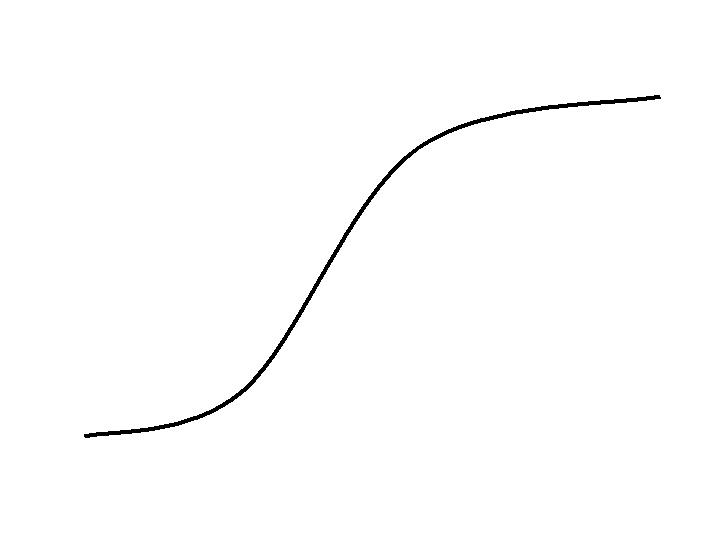
- The s-curve.
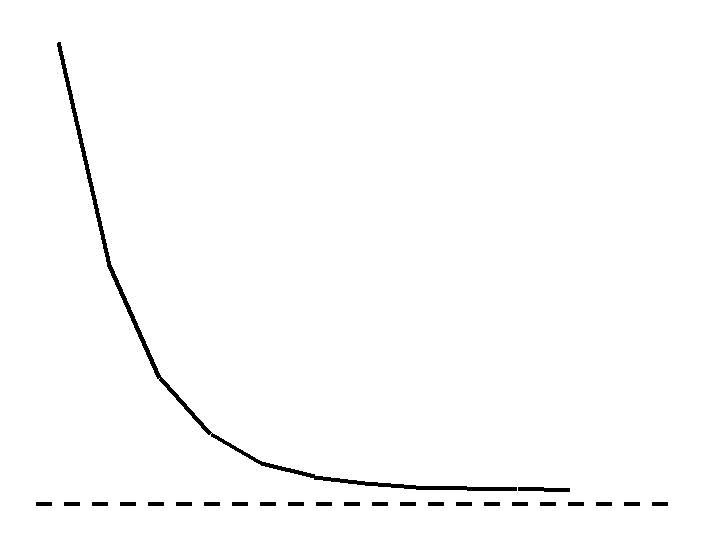
- The asymptotic relationship.
- The price/demand relationship.
Or visually:


I suspect that increasingly, we will all have to be as comfortable with using these and other relationships to characterize knowledge as we currently are with bullets, headings, and fonts.


2 comments:
This is great. I also find it useful to just "surf" the categories in Visio when trying to visualize things.
Look at the "Marketing" category for instance and see how pervasive just a few types of visualizations can become.
This is a double edged sword though, they are easily understood due to ubiquity, but they seldom provide new perspective or deeper insight.
Hi Tom,
In a conversation, they can set expectations. "The value you will get out of this course will directly correlate with the time you spend outside the class in the simulation." "Putting more programmers on the project will increase the cost linearly, but increase the speed of completion only asymptotically."
In a simulation, they are necessary to nail down the gazillions of relationships that we take for granted. It is only when we have enough of them that they start to generate interesting observations.
Post a Comment